Benchmarking Multithreaded PCSX2
As most people probably know, PCSX2 is primarily a dual-thread application. The two main threads are described as such:
- EE/Core thread emulates the PS2's EmotionEngine (including VIF, SIF, GIF, and VUs) and the IOP (including SPU2, CDVD, and PAD)
- GS thread emulates the PS2's Graphic Synthesizer (includes texture swizzling, texture filtering, upscaling, and frame rendering)
Each thread relies on the other thread in some way -- the GS thread cannot swizzle texture data until the EE thread has uploaded said data, for example. Meanwhile, the EE thread cannot upload texture data to the GS thread if the GS thread is currently bogged down rendering last week's frame to video. During these periods, either thread will sleep , only to be woken up once the other thread has caught up in its workload.
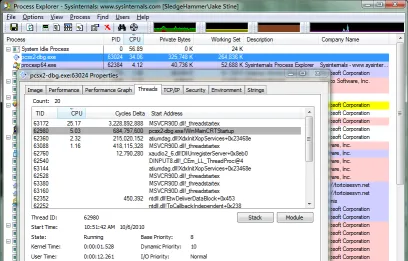
In theory the act of sleeping the EE/GS threads should make benchmarking the CPU load registered by each thread pretty easy: all modern operating systems have built-in APIs for reading the busy/idle time of any thread on the system -- this is the same API used by your tried and true task/process manager, for example:

(Air shows off his personal favorite, ProcessExplorer , part of the SysInternals Suite )
This readout is simple, efficient, and seemingly reliable. It also avoids a lot of the annoying pitfalls one runs into trying to use common alternatives such as rdtsc and QueryPerformanceCounter .
... and this is precisely the method I decided to use for PCSX2 0.9.7.r3113 (and still in use as of r3878). Simple theory really: if the GS thread is sleeping a lot (low load) then the game is bottlenecked by EE/Core thread activity. If the EE thread is sleeping a lot and the GS thread reports 90+%, then the GS thread is the bottleneck (a problem often correctable through using lower internal resolutions, for example).
But as I've recently found out, it doesn't work as expected. -_-
It's filled with... threads!
The immediate problem faced by this simple method of load detection is that the latest wave of Windows Vista/7 GPU drivers themselves are multithreaded . It should have come as little surprise that one of the primary goals of the new DWM/Aero/DX11 systems implemented into Vista/7 is scalable parallel processing that takes better advantage of modern multi-core CPUs. Why this causes the OS built-in thread load detection to fail might be less obvious; I'll explain with an example:
When the GPU driver receives a directive to render the current scene (aka 'Present' in DirectX lingo), it sends the job to a thread dedicated to the task. That thread has a Present Queue , typically 1 or 2 frames deep, that automatically handles triple buffered vsync'd page updates. If the queue is full when the PCSX2 GS thread issues its next Present request, the GPU driver will put the GS thread to sleep until a slot in the Present Queue becomes available. End result: The GS thread reports idle time to the operating system (and to PCSX2's GS window), but the GPU is still quite overloaded and bottlenecked via work supplied to it by a different thread altogether.
In essence, it is nearly the same sort of inter-thread dependence that the EE/Core and GS threads have between each other, only now the EE/Core thread's dependency chain extends to include GS and GPU driver threads (of which there could be one or many).
The solution to this problem is to use a more traditional method of manual load checking: timing various sections of code executed in-thread via either the aforementioned rdtsc (timestamp) or QueryPerformanceCounter, read at key points in the GS thread's execution/program flow. This wasn't such a great idea a few years ago, due to K8/Athlon and P4 generation CPUs lacking a stable internal clock counter. Fortunately, all modern CPUs have a consistent counter suitable for benchmarking, so the pitfalls that have been long associated with using Intel/AMD timestamps are finally obsolete enough to not be a concern for us here.